Plain Node vs. the $12 Server Challenge
Wed Oct 14 2026How many users can one $12/month server (1 vCPU, 2 GB of RAM) handle? That's the question behind the $12 Server Challenge. The same small social-feed API gets built in a bunch of languages and frameworks, then load-tested on the same DigitalOcean droplet until it breaks. There were submissions in plenty of languages, but nobody had done one in Node. I love Node, so I had to.
Spoiler: plain Node, with zero dependencies, served 20,000 simulated users at about 2,100 requests per second on a fifth of one CPU core of my desktop. My estimate for the real droplet is around 30,000 users. Here's how I got there.
The challenge
Every submission implements the same five endpoints against the same SQLite database:
GET /feed: the 20 newest posts, with author and like countGET /posts/:id: one postPOST /posts: create a post (needs a JWT)POST /posts/:id/like: like a post (needs a JWT)GET /health
Scoring uses k6. Each simulated user reads the feed, opens a post, sometimes likes or writes one, and idles between steps, like a real person scrolling. Your score is the most users your server can hold for 5 minutes with p95 latency under 500 ms, p99 under 1 s and fewer than 1% errors.
The rules keep it honest:
- No caching across requests. Every request reads SQLite while it's being served, and every JWT signature gets verified.
- Writes are durable before you respond. WAL mode with
synchronous=NORMALor stronger. - The schema is fixed, and responses must match the spec byte for byte (42 checks).
- Run behind their Nginx config, or serve the internet directly and hold up to ~15,000 open connections yourself.
My ground rules: just Node
No Express, no npm packages, no node_modules. Node 24 ships everything this needs:
node:sqlitefor the database (built into Node now)node:cryptoto verify HS256 JWTs by handnode:httpat first, and later justnode:net(more on that below)
I skipped Nginx and serve direct on port 80. On a single vCPU, Nginx eats CPU your app could be using, and Node is good at holding lots of idle keep-alive connections.
Testing without the droplet
I didn't want to rent servers for every experiment, so I boxed the server in on my own machine. Linux cgroups (what Docker's --cpus and --memory use under the hood) can limit a process to a slice of one core, 2 GB of RAM and no swap, with no Docker and no sudo:
systemd-run --user --scope \
  -p CPUQuota=20% -p MemoryMax=2G -p MemorySwapMax=0 \
  taskset -c 0 node index.js
k6 runs on the other cores, never on the server core's hyperthread sibling, because siblings share one physical core and would skew the numbers. Then I squeezed the CPU quota until the server broke.
The most useful number turned out to be CPU time per request: the cgroup's total CPU (user plus kernel) divided by requests served. I tried the V8 CPU profiler too, but with the server pinned to one throttled core it double-counted time when the CPU was maxed out and missed most of it when it wasn't. It was fine for finding hot spots, but useless for comparing versions.
Version 1: plain node:http
The first version was simple: a hand-rolled router on node:http, statements prepared once, and sensible SQLite pragmas (WAL, a 64 MB page cache, 256 MB of mmap). It passed all 42 checks and handled 10,000 users without breaking a sweat. A profile said the feed query was the biggest single cost, followed by Node's own HTTP machinery.
Step 2: let SQLite write the JSON
The feed returns 20 posts. Normally that means 20 row objects crossing from SQLite into JavaScript, then JSON.stringify building the response, then the garbage collector cleaning up the objects. Instead, SQLite builds the whole response body and hands JavaScript one string:
SELECT '{"posts":' || json_group_array(
         json_object('id', id, 'body', body, 'created_at', created_at,
                     'author', username, 'like_count', like_count)
         ORDER BY created_at DESC, id DESC) || '}'
  FROM (SELECT ... ORDER BY p.created_at DESC, p.id DESC LIMIT 20)
json_object keeps keys in the order you give them, so the output matched the spec byte for byte. I checked it against the golden files and 20,000 random posts. The feed went from about 32 µs to 22 µs, with far less garbage to collect.
One idea I turned down: batching feed reads, so one query answers every request in a 100 ms window. That's a query-result cache, which the rules forbid. It would also add up to 100 ms of latency to save about 10 µs. Not worth it.
Step 3: drop node:http and speak HTTP myself
Once SQLite was fast, most of the CPU went to Node's HTTP layer: request and response objects, streams and events for every request. Each request here is tiny, so that overhead was most of the work.
So I replaced node:http with node:net. The server reads raw bytes off each TCP socket and parses only the request line and the four headers it actually uses (Content-Length, Authorization, Connection and Expect). It writes each response as one string:
function response([status, body], close) {
  return `HTTP/1.1 ${status} ${REASON[status]}\r\nContent-Type: application/json\r\n` +
    `Content-Length: ${Buffer.byteLength(body)}\r\nDate: ${date}\r\n` +
    `${close ? 'Connection: close\r\n' : ''}\r\n${body}`;
}
That's the scary part. Now I own keep-alive, pipelining and partial reads. Beyond the official 42 checks, I wrote raw-socket tests for the nasty cases: requests sent one byte at a time, bodies split across packets, several requests in one packet, Expect: 100-continue, HTTP/1.0, garbage input, oversized headers and bodies, and a client that sends without ever reading. All of them pass.
The results
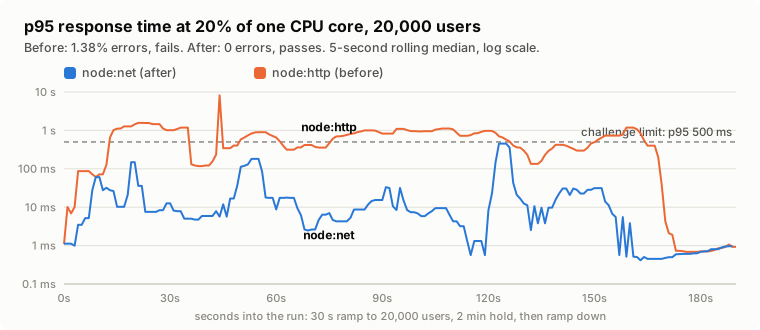
Same 20,000 users, same CPU squeezed to 20% of one core. The node:http version spent the run above the 500 ms limit and dropped 1.38% of requests: a fail. The node:net version stayed mostly between 1 and 50 ms with zero errors, and served 10% more requests in the same time.
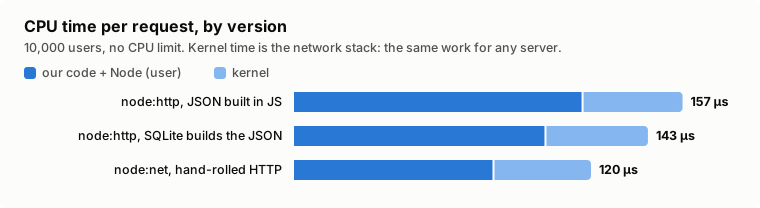
CPU per request went from 157 µs to 120 µs. The kernel part (about 40 µs, the network stack) barely moved, because it's the same work for any server. The time spent in our code and Node itself dropped from 117 µs to 81 µs, a 31% cut.
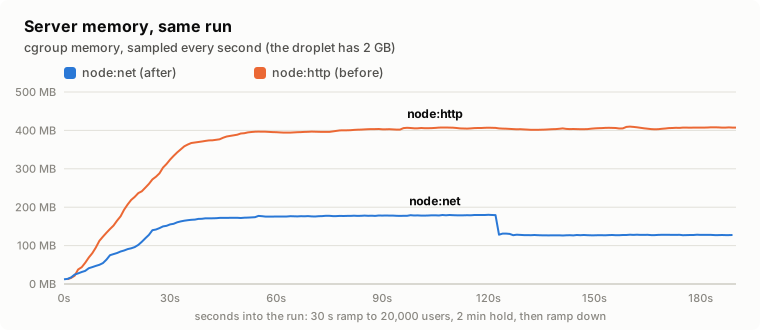
Memory went from about 400 MB to under 180 MB. See the sudden drop in the blue line around two minutes in? I chased it down with --trace-gc. It's V8's memory reducer: once the load settled, it did a full collection and shrank the heap from 100 MB reserved down to 37 MB. Live data was only ~35 MB the whole time. Nothing leaked, but that collection paused the server for 107 ms, which you can see as the latency bump at the same moment. That's the next thing I'd tune.
So how many users?
| CPU (share of one core) | 20,000 users |
|---|---|
| 20% | pass: p95 110 ms, 0 errors, ~2,100 requests/s |
| 17% | fail: p95 2.3 s |
| 15% | fail: p95 4 s, 3.8% errors |
On my machine, 20,000 users needs about a fifth of one core. A droplet's shared vCPU is slower than my desktop core, a real network costs more kernel time than localhost, and the OS shares that one CPU. So my honest estimate for the real droplet is around 30,000 users. The official benchmark will tell.
What I learned
- Measure CPU per request, not just latency. Latency flips from fine to terrible at the knee, so it tells you which side of the knee you're on. CPU per request tells you how far away the knee is.
- Profilers can lie. On a throttled core, the V8 profile was off by 2 to 3 times, too high in one run and too low in another. The cgroup's own CPU accounting stayed consistent.
- Let the database do the work it's good at. SQLite building JSON beat JavaScript building JSON.
- Node's built-in HTTP is convenient, not free. For tiny requests, a small hand-rolled parser on
node:netcut 18% of the CPU and half the memory. - Plain Node holds its own. No framework, no dependencies, about 280 lines.
Links
- The $12 Server Challenge: the rules, spec and other languages
- My Node submission: the code and full measurements
- The pull request: waiting on the official benchmark
Note: Claude Code was used to aid in this experiment.